Table of Contents
Introduction
The dashboard is the first thing a user sees when logging into Engage Insights. In addition to the left hand menus that shows all of the modules present in the system, users will also be able to see overall analytics covering surveys that are currently in progress in the UI.
Additionally, various filters can be used to see various data points across different dimensions, survey types, and more. More info on the category filter can be found in our support article here.
At the very top of the page, users have the option to launch a new survey or poll straight from the homepage as shown below:
Right below that, there is a filter button that allows users to a date range (e.g. last 30 days, 60, Custom) for the survey analytics shown, as well as filtering by survey type, dimensions, etc.:
Additionally, the "Export PDF" button allows you to export a PDF version of the homepage to your computer.
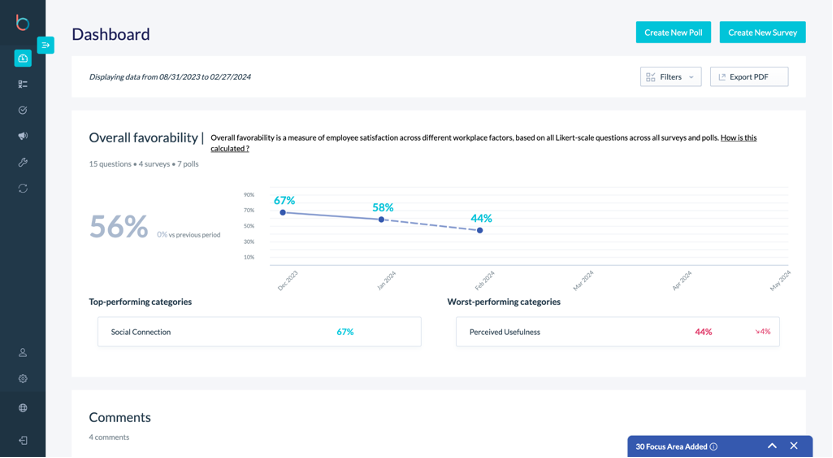 Total Favorability
This section shows the favorability scale averages, broken down by overall percentages (shown in the line graph) as well as top and bottom performing categories with regards to favorability. The data here will change depending on the filters set in the dashboard:
When you click on "How is this calculated?" located at the end of the description, a pop-up window will appear, detailing the methodology used to calculate the overall favorability score:
Comments
This section will aggregate overall sentiment, as well as circle breakdowns of positive/negative comments across different categories in your survey reports:
Segments
Based on the preset and custom dimensions that are set up in Engage, this section will break down sentiments among different segmentations of users that have completed surveys.
Strongest and weakest segments, as well as deltas in sentiments among segments will be measured here. Additionally, hovering your mouse cursor over any segment will show a focus area button that can be clicked in order to create an action plan. More info on that can be found in our support article here.
Action Plans/Latest Activity
This final section will show active action plans that need to be completed or in progress. Those with a red exclamation mark are those that require more urgent action since the due date has been passed.
Recently launched/closed surveys and polls will show under the "Latest Activity" box, and any box shown there can be clicked to take you to the respective survey/poll report.